3.3 R语言性能可视化lineprof
问题
有没有一个可视化的性能监控工具?
引言
数据可视化越来越受到人们的追捧,图形比文字更有表达力,基于HTML的可交互的图形比静态的PNG图片更让人惊喜。R语言已经为数据可视化做了充分的准备,比如,图形可视化包ggplot2,世界地图可视化包ggmap,股票可视化包quantmod ,基于HTML的可交互的可视化包googleVis等,简简单单的几行代码,就可以让数据变成图片,再让图片变成会动的图片。本节以“性能报告”为切入点,讲述R语言可视化包lineprof。
3.3.1 lineprof介绍
lineprof是一个数据可视化的项目,目标是更友好地可视化性能监控效果。3.2节通过profr库,可以把性能数据以图片的形式输出,但仅仅是一张静态图片。而lineprof可以做得更好,生成基于shiny的可交互的网页,让你自己动手发现问题。
lineprof项目也是Hadley Wickham的作品。目前项目只在github上面发布,项目地址是https://github.com/hadley/lineprof
lineprof的API介绍
lineprof库的API主要有以下两类函数。
功能函数:
- focus: 设置显示高度zoom
- auto_focus: 自动设置显示高度zoom
- lineprof: 记录CPU和内存的占用
- shine: 用shiny输出
内部函数:辅助功能函数
- align: 源代码对齐
- find_ex: 用于加载demo
- line_profile: 格式化性能监控数据的输出(Rprof)
- parse_prof: 格式化输出
- reduce_depth: 设置输出的深度
3.3.2 lineprof安装
本节使用的系统环境是:
- Linux: Ubuntu Server 12.04.2 LTS 64bit
- R: 3.0.1 x86_64-pc-linux-gnu
- IP: 192.168.1.201
注:lineprof只支持Linux环境。
由于项目lineprof还没有发布到CRAN,在lineprof包安装时,仅支持从github安装。所以,需要通过devtools包来安装github上面发布的R语言项目。
~ R                                  # 启动R程序
> library(devtools)                   # 加载devtools
> install_github("lineprof")           # 通过devtools工具,安装linepro
> install_github("shiny-slickgrid", "wch")  # 安装制定的shiny控制台
> library(lineprof)                            # 加载lineprof
3.3.3 lineprof使用
我们使用官方提供的例子,介绍lineprof包使用。
> source(find_ex("read-delim.r"))  # 加载脚本文件read-delim.r
> wine <- find_ex("wine.csv")      # 加载测试数据集
> x <- lineprof(read_delim(wine, sep = ","), torture = TRUE) # 执行read_delim算法,并通过lineprof记录性能指标
Zooming to read-delim.r (97% of total time)
对例子资源的介绍:
- read-delim.r: 目标函数的脚本文件
- wine.csv: 测试数据集
- x: lineprof生成的数据报告
查看文件:read-delim.r。
function(file, header = TRUE, sep = ",", stringsAsFactors = TRUE) {
  # Determine number of fields by reading first line
  first <- scan(file, what = character(1), nlines = 1, sep = sep, quiet = TRUE)
  p <- length(first)
  # Load all fields
  all <- scan(file, what = as.list(rep("character", p)), sep = sep,
    skip = if (header) 1 else 0, quiet = TRUE)
  # Convert from strings to appropriate types
  all[] <- lapply(all, type.convert, as.is = !stringsAsFactors)
  # Set column names
  if (header) {
    names(all) <- first
    rm(first)
  } else {
    names(all) <- paste0("V", seq_along(all))
  }
  # Convert list into data frame
  class(all) <- "data.frame"
  attr(all, "row.names") <- c(NA_integer_, -length(all[[1]]))
  all
}
加载文件:wine.csv。
> df<-read.csv(file=wine)
> object.size(df)    # 数据集占内存大小
20440 bytes
> head(df,3)    # 显示前3行数据
  type alcohol malic  ash alcalinity magnesium phenols flavanoids nonflavanoids proanthocyanins color  hue dilution proline
1    A   14.23  1.71 2.43       15.6       127    2.80       3.06          0.28            2.29  5.64 1.04     3.92    1065
2    A   13.20  1.78 2.14       11.2       100    2.65       2.76          0.26            1.28  4.38 1.05     3.40    1050
3    A   13.16  2.36 2.67       18.6       101    2.80       3.24          0.30            2.81  5.68 1.03     3.17    1185
x对象: lineprof生成的数据报告
> x                           # 记录性能指标的对象
Reducing depth to 2 (from 8)
Common path:
    time alloc release dups      ref               src
1  0.002 0.001   0.000    0  #3 read_delim
2  0.049 0.009   0.003   11  #3 read_delim/scan
3  0.026 0.001   0.008    0  #4 read_delim
4  0.379 0.072   0.006   14  #7 read_delim/scan
5  0.003 0.000   0.000    0 #11 read_delim
6  0.106 0.015   0.030    3 #11 read_delim/lapply
7  0.008 0.004   0.000    3 #11 read_delim
8  0.210 0.028   0.077   36 #16 read_delim/rm
9  0.004 0.001   0.000    1 #22 read_delim
10 0.035 0.005   0.004    8 #23 read_delim/[[
11 0.002 0.000   0.000    1 #23 read_delim/length
12 0.001 0.000   0.000    1 #23 read_delim/c
13 0.006 0.004   0.000    1 #23 read_delim
14 0.001 0.000   0.000    0 #23 read_delim/attr<-
用shinySlickgrid库,把性能指标数据可视化,并以网页形式输出。
> library(shinySlickgrid)     # 加载shinySlickgrid库
> shine(x)                    # 启动shiny程序
Loading required package: shiny
Shiny URLs starting with /lineprof will mapped to /home/conan/R/x86_64-pc-linux-gnu-library/3.0/lineprof/www
Shiny URLs starting with /slickgrid will mapped to /home/conan/R/x86_64-pc-linux-gnu-library/3.0/shinySlickgrid/slickgrid
Listening on port 6742
shiny会自动在后台打开一个Web服务器,默认的Web访问端口是6742,之后就可以通过浏览器远程访问了。打开浏览器地址栏输入 http://192.168.1.201:6742 ,如图3-5所示。
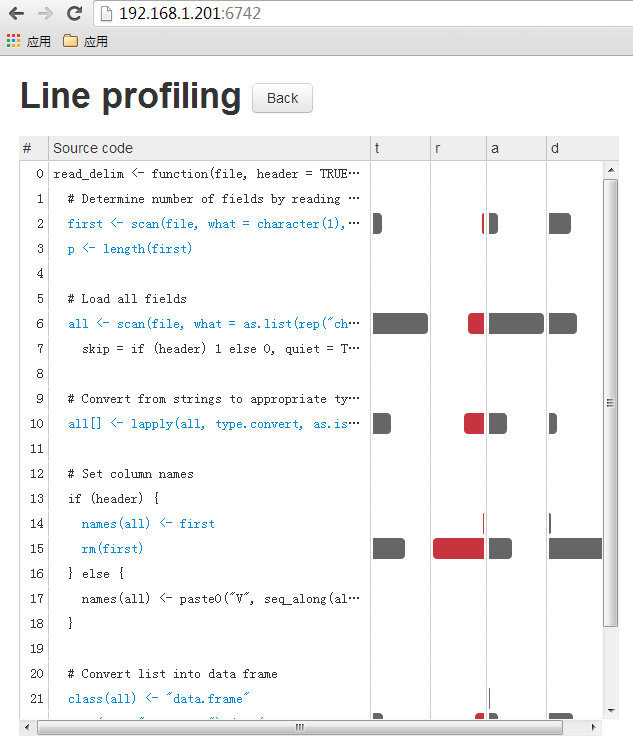
图3-5 可视化性能监控
在图3-5中,网页的表格一共有6列,字段解释如下:
: 行号
- source code: 监控的目标函数源代码
- t: (total)当前行执行的总时间(秒)
- r: (released) 释放内存量
- a: (allocated) 分配内存量
- d: (duplicates)重复次数
下面给出函数性能数据的解释。
6(第6行),用于加载数据,总时间占用:0.309s,分配内存:0.064mb,方法重复次数:14次
15(第15行),用于清除数据,总时间占用:0.179s,释放内存:0.065mb,方法重复次数:37次
通过lineprof可视化工具,我们生成的报告,更灵活,更直观,更好看,还有用户交互,甚至是网页版本的。如果再和3.2节R语言性能监控工具Rprof 的效果比较一下,你会惊叹R语言是如此强大,它的进步如此神速。当然,R语言具有无限的潜力,需要更多人来推动它进步,希望你也能给它助力。